“What content performs best on Facebook?”
It’s a broad question that can have as many answers as publishers, making it a bit complicated. Let’s narrow things down by starting with what Facebook says you should not post:
- Content that impedes our ability to foster a safe community
- Sensitive or Low-Quality Content about Health or Finance
- Content that Users Broadly Tell us they Dislike
- Content that is associated with low-quality publishing
- False or Misleading Content
Visit Facebook’s recommendations page for examples of each category. This may not help you decide what to post, but it can help you figure out what to avoid!
How do you know what you should post?
If you’re looking at what performs best, the only helpful answer is going to be the one that is specific to your audience and your content. You’re going to want to take a look at the following:
- Post Types: The first thing we look at when it comes to what to post on Facebook is post type (Link, Photo, Video, etc). For most publishers, there’s an ideal formula as to the ratio of engagement driving posts (i.e. Photo and Video posts) versus traffic driving posts that should be made to grow traffic while maintaining a health page. What does your current % breakdown look like below?
- Link Posts: ___ %
- Photo Posts ___ %
- Video Posts ____ %
- Content Types: Our most successful publishers pursue a balanced posting cadence of New Content vs Evergreen, and Recent Recirculation. What content by age or type consistently performs well for you on Facebook? Generally, we see unposted content and evergreen perform highest, then recirculation of recently published content.
- Evergreen
- New
- Recent recirculated
- Average Impressions per Post: Impression metrics are the holy grail to understanding how the Facebook algorithm treats your Page and content. What is your average impression per post by Content Type, Post Type, and Time of Day? Knowing the answer to this question is the key to unlocking what you should do more or less of on Facebook.
- Click Through Rate (CTR): Which content is getting your audience to click? Rate of clicks in relation to Impressions is one of the most important metrics after impressions (above) on Facebook to drive traffic and measure how effective you are getting your most clickable content in front of your audience on Facebook. You may need to categorize your content or group it in a different way to see patterns. Look at the type of content (new, evergreen, recirculation), the time it was posted, by topic categories, keywords, and any other relevant factors for your production.
- Average Link Click (or Referral) per Post: How many referrals or link clicks from Facebook are your posts driving to your website? This is another golden metric to optimization on Facebook. If you are optimizing to Impressions and Click Through Rate above, the outcome is going to be higher Average Link Clicks per Post. This means more traffic. Spend some time grouping your content and determine which groups and times during the day have the highest average referral rate.
- Average engagement per post: While likes, reactions, shares, and comments can be a vanity metric, high engagement rates typically result in greater Page Reach and Post Impressions – all important to increasing visibility in Feed and fostering a healthy page.
- Peak posting times: This refers to when your audience is online and most responsive to your content and Facebook Page. If you aren’t sure how to find this, this is worth a read. An Facebook API pull can help you understand when your audience is online. Tip: There’s more to it than just the Facebook “whale.”
Here’s an example of how all of these elements can be visualized using Facebook’s Graph API. 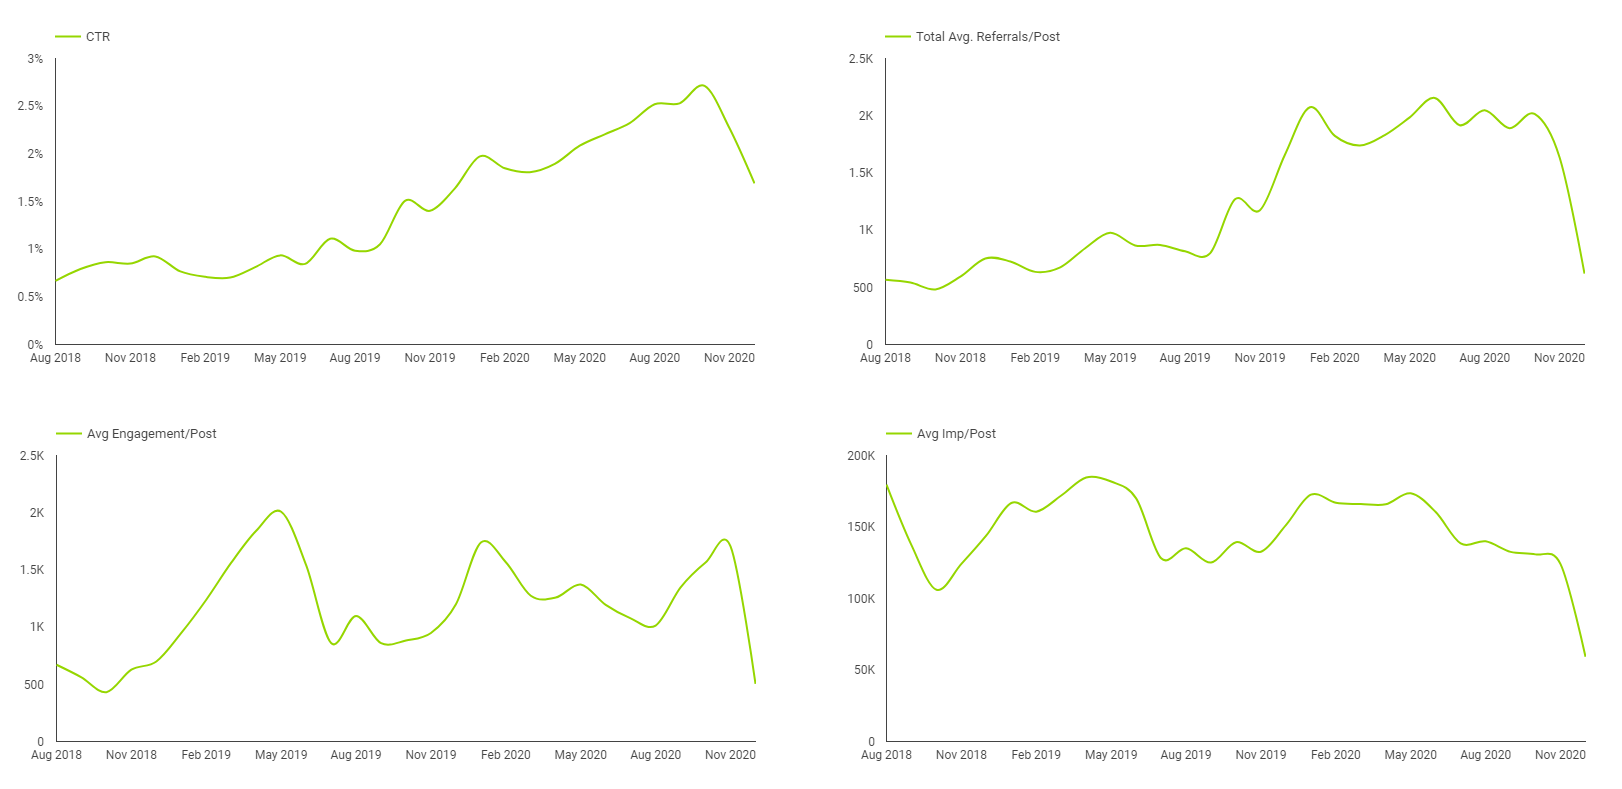
Still having trouble with what works on Facebook? We’re here.
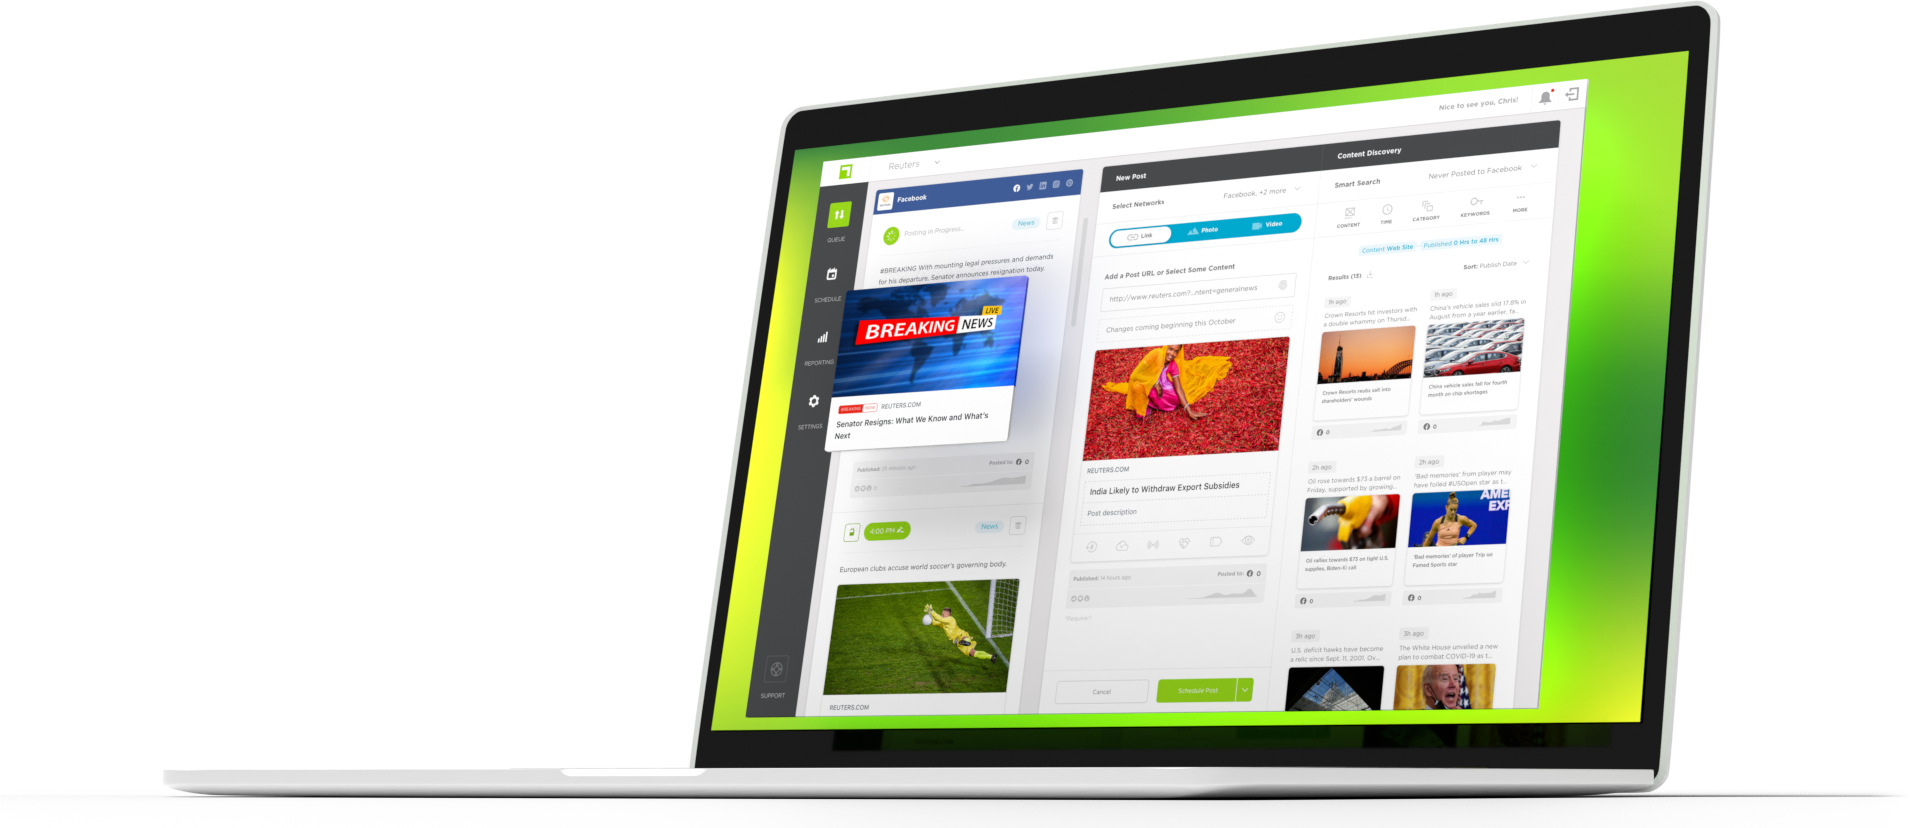
If all this seems like a lot of work and a bit overwhelming, True Anthem is here to help. We can provide this data to you in easy to digest reporting to help inform strategy and make quicker, data-driven decisions.
True Anthem: Solution makes it easy for you to analyze and re-post popular content to see for yourself which emojis attracted the most traffic and engagement. Also, be sure to sign up for our social media newsletter.