At True Anthem, we pride ourselves on a partner-driven focus and dedication to the success of every single team we support. We are always listening to feedback from our partners, and one of the most resounding elements has been the need for more insights and reporting.
We are super excited to announce our new reporting suite. These modules bring intuitive insights directly to your teams to help enable faster data-driven decisions with your social publishing.
Targeted Timeframe Report
The Targeted Timeframe Report focuses on a 2-year window into the performance of the individual or multiple pages in aggregate for all platforms True Anthem supports: Facebook, Twitter, LinkedIn, Instagram, and Pinterest. This report has a monthly and weekly view and the ability to pick custom date ranges to help hone in on different performance periods.
All these graphs and tables are fully exportable in both PDF and .csv to allow easy sharing. In addition, this report offers a monthly email capability, sending you this report on the 3rd of every month directly to your inbox.
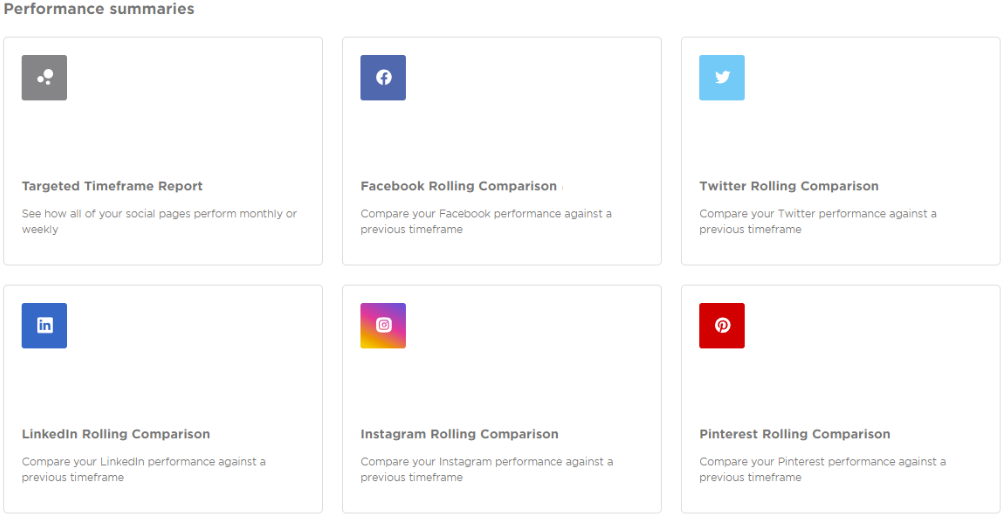
Rolling Comparison Reports
The Rolling Comparison Reports help our partners dig into performance period comparison. The report is a 1-year lookback of data and provides insights to help start finding social publishing “successes” and “learning opportunities” to optimize.
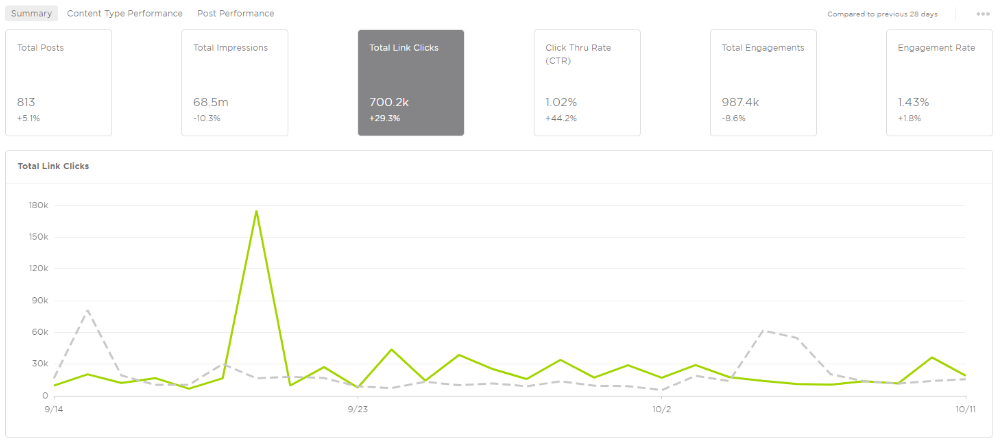
This report has three key sections:
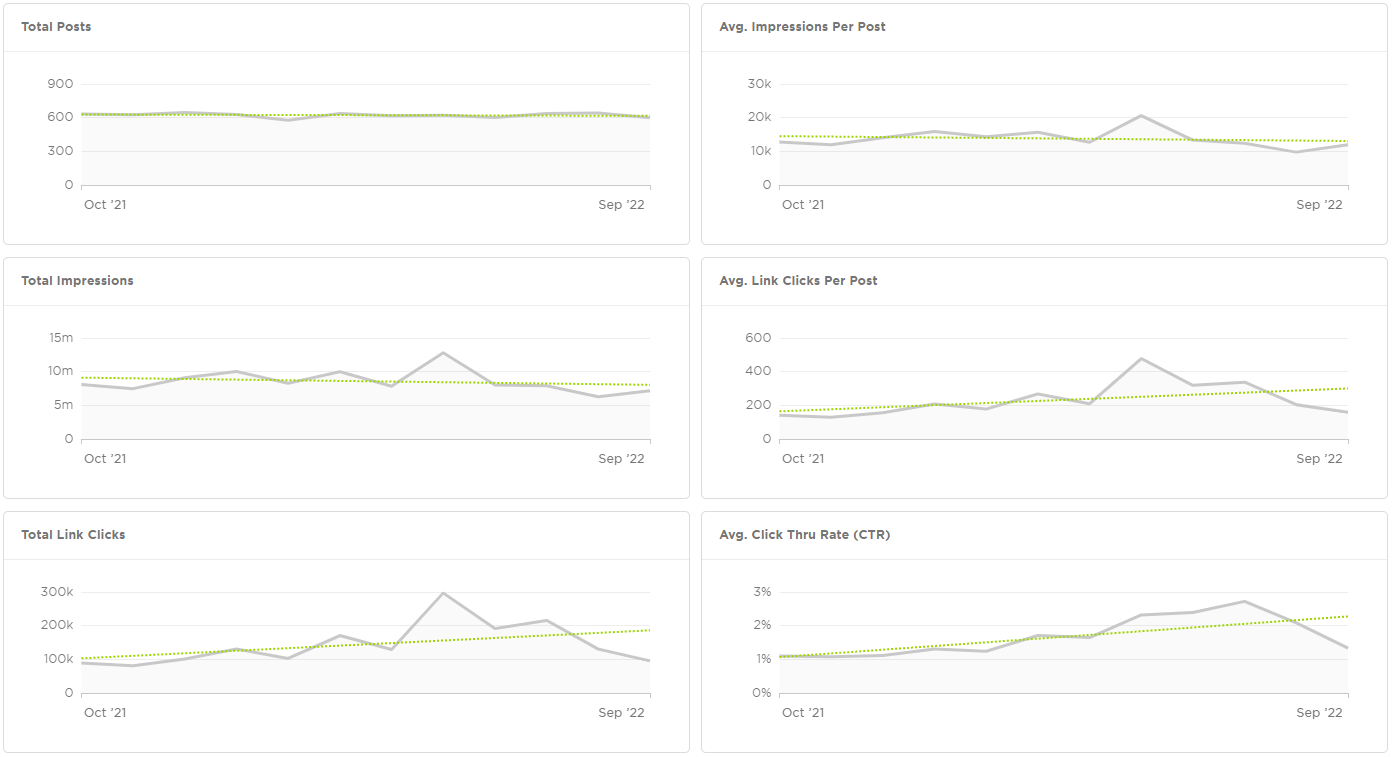
- Summary Report: This section provides an interactive chart to visually see the changes in performance between periods in a daily metric breakdown. Simply clicking the metric card that shows the KPI you are interested in will transform the chart below to represent that metric.
- Content Type Performance Report: Automation is our bread & butter, and we want to share that fantastic performance directly with you, our partners. This section will summarize every automation routine we leverage to identify your content and give the social performance surrounding that routine within the selected time range.
In addition to our automation routines, we also show any posts done Natively (Posts published to social networks from outside of True Anthem) and User Scheduled (Posts manually scheduled into True Anthem Dashboard)
- Post Performance: At the base of this report, it’s a table listing every post that went out during the selected time range. But it comes packed with all the details about the post to help hone in on winning social content.
Hovering over the gray section of each post will create a visual representation of that post on the platform so you can quickly identify what the post looks like live on the respective social platform.
We are constantly innovating at True Anthem to offer more opportunities for our partners to keep taking their success to the next level.
We encourage everyone to dig into these reports and let us know all of your feedback, good or bad. You won’t hurt our feelings. We rely heavily on the input from our partners to help us build the tools to enable publishers’ success.
As always, thank you for being an AMAZING partner!